2024 · Completed
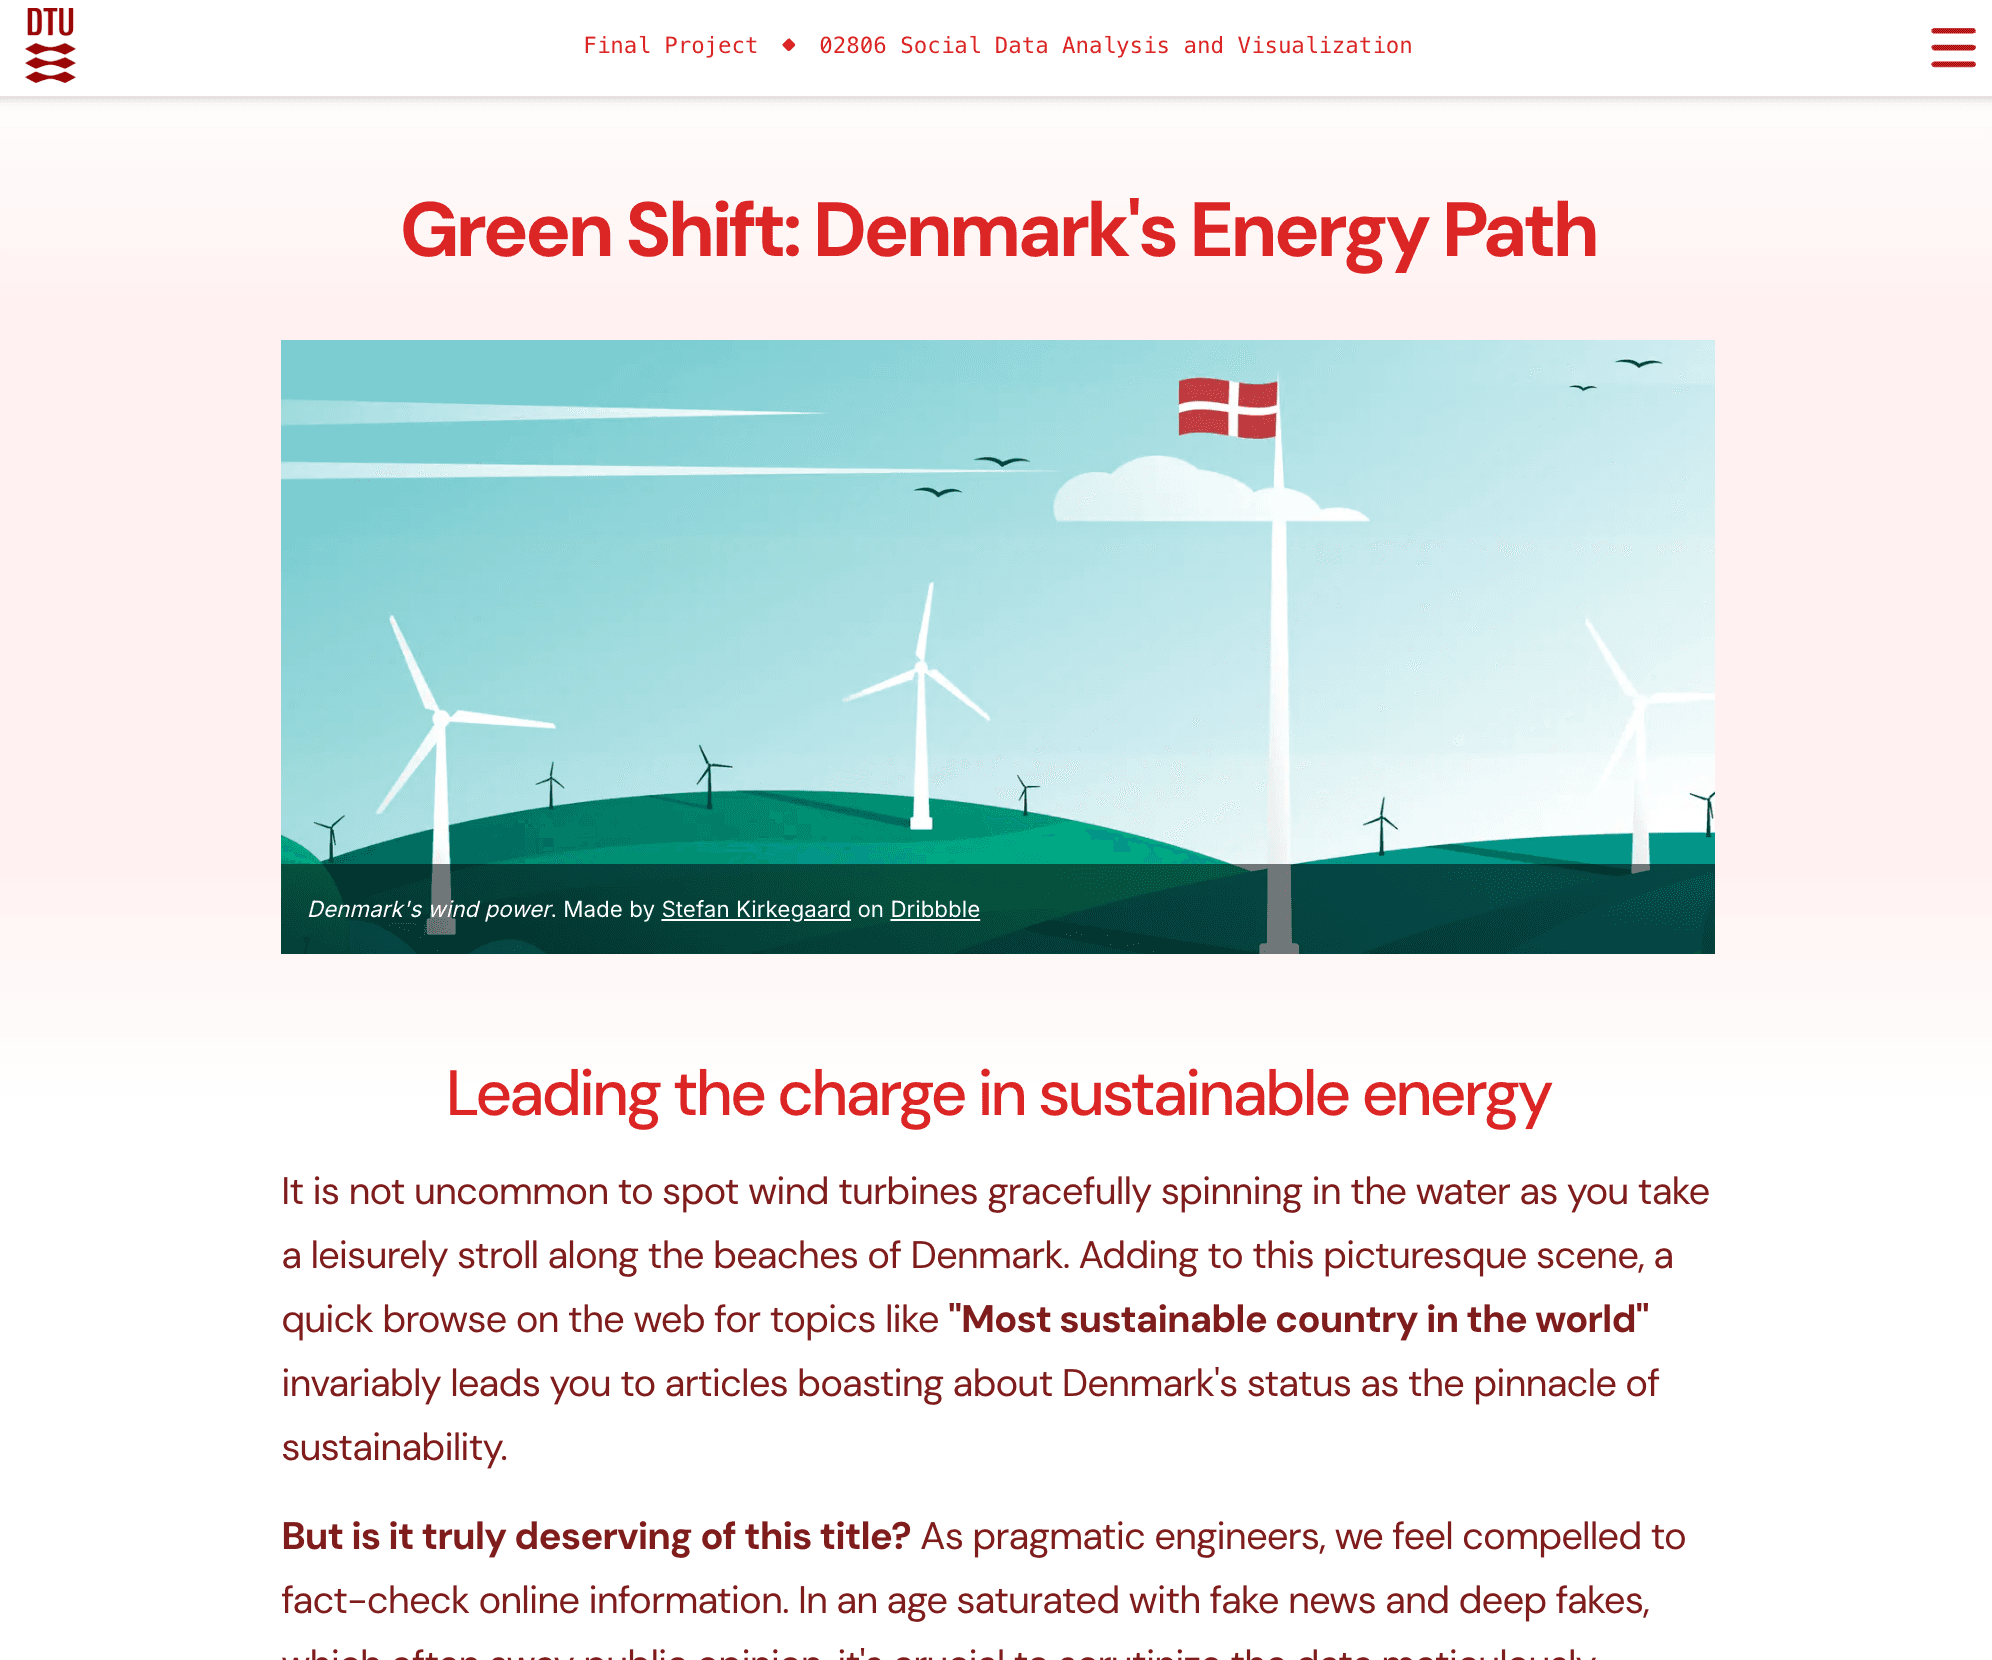
Green Shift: Denmark's Energy Path
A narrative data-visualization site examining Denmark's energy transition through interactive charts and notebook-backed analysis.
Overview
Green Shift was created as the final project for 02806 - Social Data Analysis and Visualization at DTU. The central question was whether Denmark is actually as green as its reputation suggests, and the answer was told through a short narrative website rather than a traditional written report.
The project covers air quality, greenhouse gas emissions, fossil fuels versus renewables, energy consumption and production, and Denmark compared with Europe and the wider world. A dedicated notebook page exposes the longer analytical workflow behind the story and makes the research process easier to inspect.
On the implementation side, the site uses Next.js 14, React 18, TypeScript, Tailwind CSS, and Headless UI, while the analysis stack relies on Python, Jupyter, pandas, NumPy, plotting libraries, and Flourish for the final interactive charts. The team wrapped the project on 7 May 2024 and published it as a public frontend repository.
Highlights
- Built a narrative website around Denmark's energy transition instead of presenting the analysis as a static report.
- Combined Python and Jupyter-based data work with polished Flourish embeds inside a Next.js frontend.
- Finished on 7 May 2024 as the final project for DTU course 02806, Social Data Analysis and Visualization.